


QR code tracking works through a dynamic QR code that points to a short redirect URL on a tracking platform. When someone scans the printed pattern, their phone hits that redirect server, which logs the timestamp, approximate location, device, and OS, then forwards the user to your real destination. The scan appears in your analytics dashboard within seconds.
The Quick Picture: Tracking in 30 Seconds
The mechanism is simple, but most marketing teams treat QR scans as a black box. They print the code, hope for the best, and never connect the offline scan to a revenue moment. Every scan carries useful metadata, and once you attach UTM parameters, those scans flow into the same attribution tools you already use for paid and organic.
From three years writing about dynamic QR, the pattern is the same: the teams that get value from QR aren't the ones with the prettiest codes. They're the ones who treat the QR as a tracking link first and a graphic second. This guide covers the full mechanism, what data you actually get, how to wire it into GA4, and the mistakes that quietly kill attribution.
What you'll need:
- A dynamic QR code generator (a static code can't be tracked)
- A destination URL you control (so you can append UTM parameters)
- Access to your analytics platform (GA4, Mixpanel, or your QR provider's dashboard)
- About 30 minutes for the first setup
- Skill level: beginner-friendly
What QR Code Tracking Actually Is

QR code tracking is the process of recording each scan as an event, along with the metadata the receiving server reads from the request: timestamp, IP-derived geography, device, OS, and sometimes a referrer.
The QR pattern itself doesn't track anything. The black-and-white squares are just an encoded URL. Tracking happens because that URL points to a redirect server you control. The server gets pinged on every scan, logs the request, then sends the user along to the real destination.
That's the whole trick. The "tracking" lives in the redirect, not in the code.
Static vs Dynamic QR Codes for Tracking
This is the part that trips up most first-timers, so it's worth being blunt.
A static QR code encodes the destination URL directly into the pattern. When someone scans it, their phone reads https://yourbrand.com/landing straight from the code and opens it. No server in between, no event logged. You can count footfall, but you can't count scans, because there's no system listening for them.
A dynamic QR code encodes a short redirect URL — something like qrco.de/abc123. That short URL lives on your QR provider's server. Every scan hits that server, gets logged, and then redirects to the real destination. Because the destination is stored on the provider's side rather than baked into the pattern, you can also change it after printing without reprinting the code.
If a vendor tells you a static QR code is "trackable," what they usually mean is the destination URL has UTM parameters on it, so GA4 will record the visit. That works for web traffic, but you lose the scan-level metadata (device, location, time) and you can't tell scans apart from people who typed the URL.
How QR Code Tracking Works, Step by Step
Here's the full mechanism from generation to dashboard, broken into the five stages a scan actually passes through.
Step 1: Generation — the code is created as a redirect
You log into a dynamic QR platform, paste in your destination URL, and the platform does two things at once. It creates a short redirect URL (the one that will actually be encoded into the QR pattern), and it stores your real destination URL in its database, linked to that short URL.
The QR generator then renders the short URL as a black-and-white pattern. From this point on, the pattern is fixed. What can change is the destination behind the short URL — you can edit it whenever you want, and the same printed code will start sending scans somewhere new.
Step 2: Print or placement — the pattern stays constant
You export the QR as a PNG, SVG, or PDF and put it wherever your audience will see it: a flyer, a product label, a billboard, a receipt, an in-store sign. The pattern doesn't change, so you commit ink once and edit destination behavior infinitely.
Step 3: Scan event — the phone resolves the short URL
Someone points their phone camera at the code. The camera app reads the pattern, decodes the short URL, and prompts the user to open it. They tap, and the browser sends an HTTPS request to the redirect server.
That request carries everything the server needs for analytics: the source IP, the User-Agent string (which reveals device model and OS), the time, and sometimes a referrer header if the scan came from another screen.
Step 4: Redirect server logs the event, then forwards the user
This is the moment the magic happens, and it lasts about 80 milliseconds. The server:
- Receives the incoming request
- Looks up the short URL in its database to find your real destination
- Writes a row to the analytics database:
{ short_url, timestamp, ip_country, device_type, os, user_agent, referrer } - Returns an HTTP 302 redirect pointing at your destination URL (with any UTM parameters you set)
The user's browser follows the 302 and loads the real page. They never see the redirect server, and the delay is too short to notice.
Step 5: Destination loads, scan appears in your dashboard
The destination page renders normally. If you tagged it with UTM parameters (utm_source=poster&utm_medium=qr&utm_campaign=spring2026), GA4 picks them up and credits the session to that campaign.
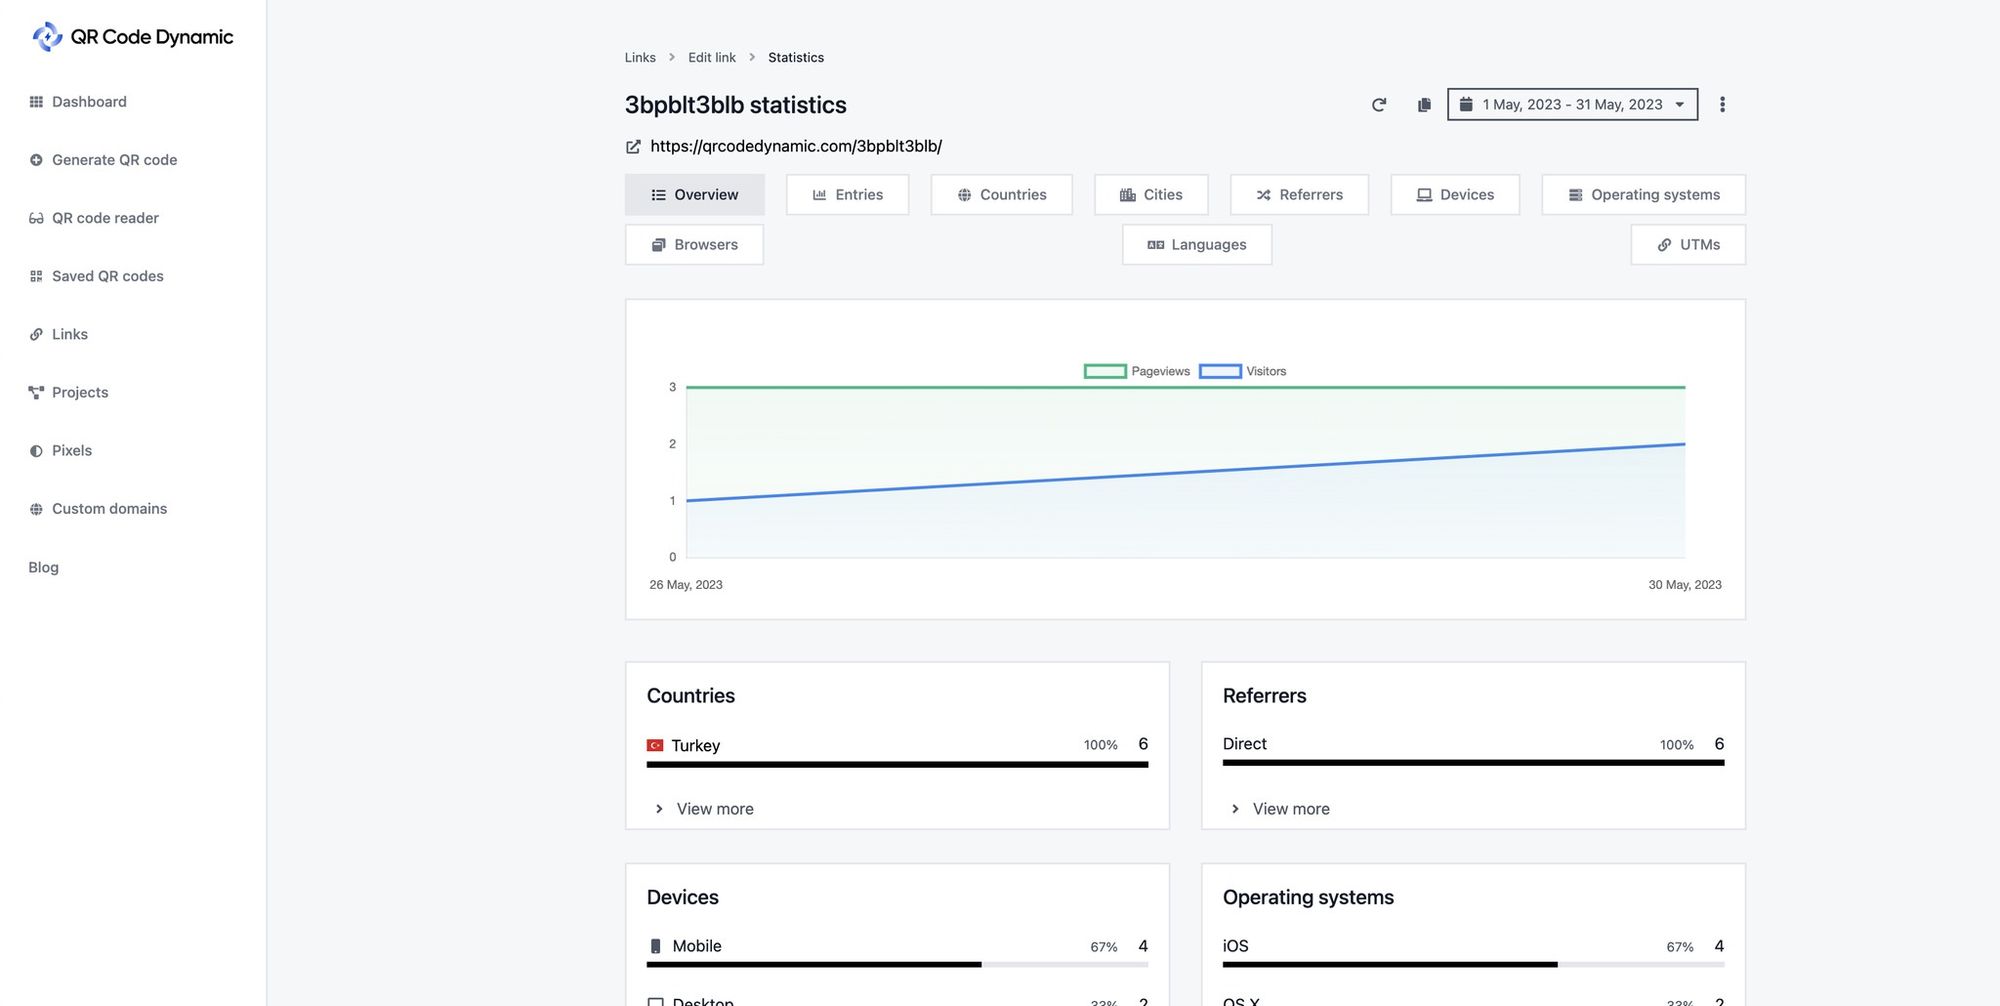
Meanwhile, your QR platform's dashboard reflects the scan within a second or two. You'll see the count tick up, the new geography appear on the map, and the device split refresh. That's the full loop — pattern, scan, log, redirect, dashboard.
What Data Does QR Code Tracking Capture?
The depth of metadata is the part most introductory articles skip, so here it is in full. Each scan generates a record that typically includes the following fields.
- Scan count, total and unique. Total scans counts every event. Unique scans deduplicate by device fingerprint or cookie within a window (usually 24 hours). The gap between these two numbers is one of the most useful signals you have.
- Timestamp. Precise to the second, in the platform's timezone. Aggregate this into day-of-week and hour-of-day curves to see when your audience actually engages.
- Geographic data. Country, region, and city, derived from the scanner's IP address. It's not GPS-level — you won't get a street address — but it's accurate enough to compare campaigns across markets.
- Device type. Phone, tablet, or desktop, plus the model when the User-Agent reveals it (most modern iPhones and Android devices do).
- Operating system and version. iOS 18.4 vs Android 15, for example. This matters if your destination is an app — you'll see who needs the iOS link and who needs the Play Store.
- Referrer. If the scan happens from a screen (a code embedded in a YouTube video, an Instagram story), the browser sometimes includes the originating URL.
- Repeat scan rate. The percentage of scans coming from devices that have scanned the same code before. High repeat rates signal loyal interest or a code that's part of someone's daily routine; low repeat rates suggest one-off curiosity.
How to Set Up QR Code Tracking (in 5 Steps)
The setup takes about half an hour the first time. Repeat campaigns are five minutes once you have a template.
Step 1: Pick a dynamic QR platform
Use any provider that creates dynamic codes and exposes the scan-level metadata I listed above. Most providers offer a free tier that's enough for a single campaign. For this guide I'll use QR Code Dynamic, which is what I work with day to day.
Two checks before you commit: does the platform let you edit the destination URL after printing (this is the whole point of dynamic), and does it export scan data as CSV or via API (so you can join it to other datasets later).
Step 2: Build the destination URL with UTM parameters
Before you generate the code, prepare the final URL the redirect will point to. Add UTM parameters so GA4 can attribute the session correctly. A clean template looks like this:
https://yourbrand.com/spring-promo
  ?utm_source=poster
  &utm_medium=qr
  &utm_campaign=spring2026
  &utm_content=back-cover
The conventions I use across campaigns:
- utm_source = the physical placement (poster, receipt, shelf-talker, packaging)
- utm_medium = always
qr, so you can filter every QR session in one click - utm_campaign = the marketing campaign name, identical across all touchpoints
- utm_content = the variant or location, when you're running A/B or multi-placement tests
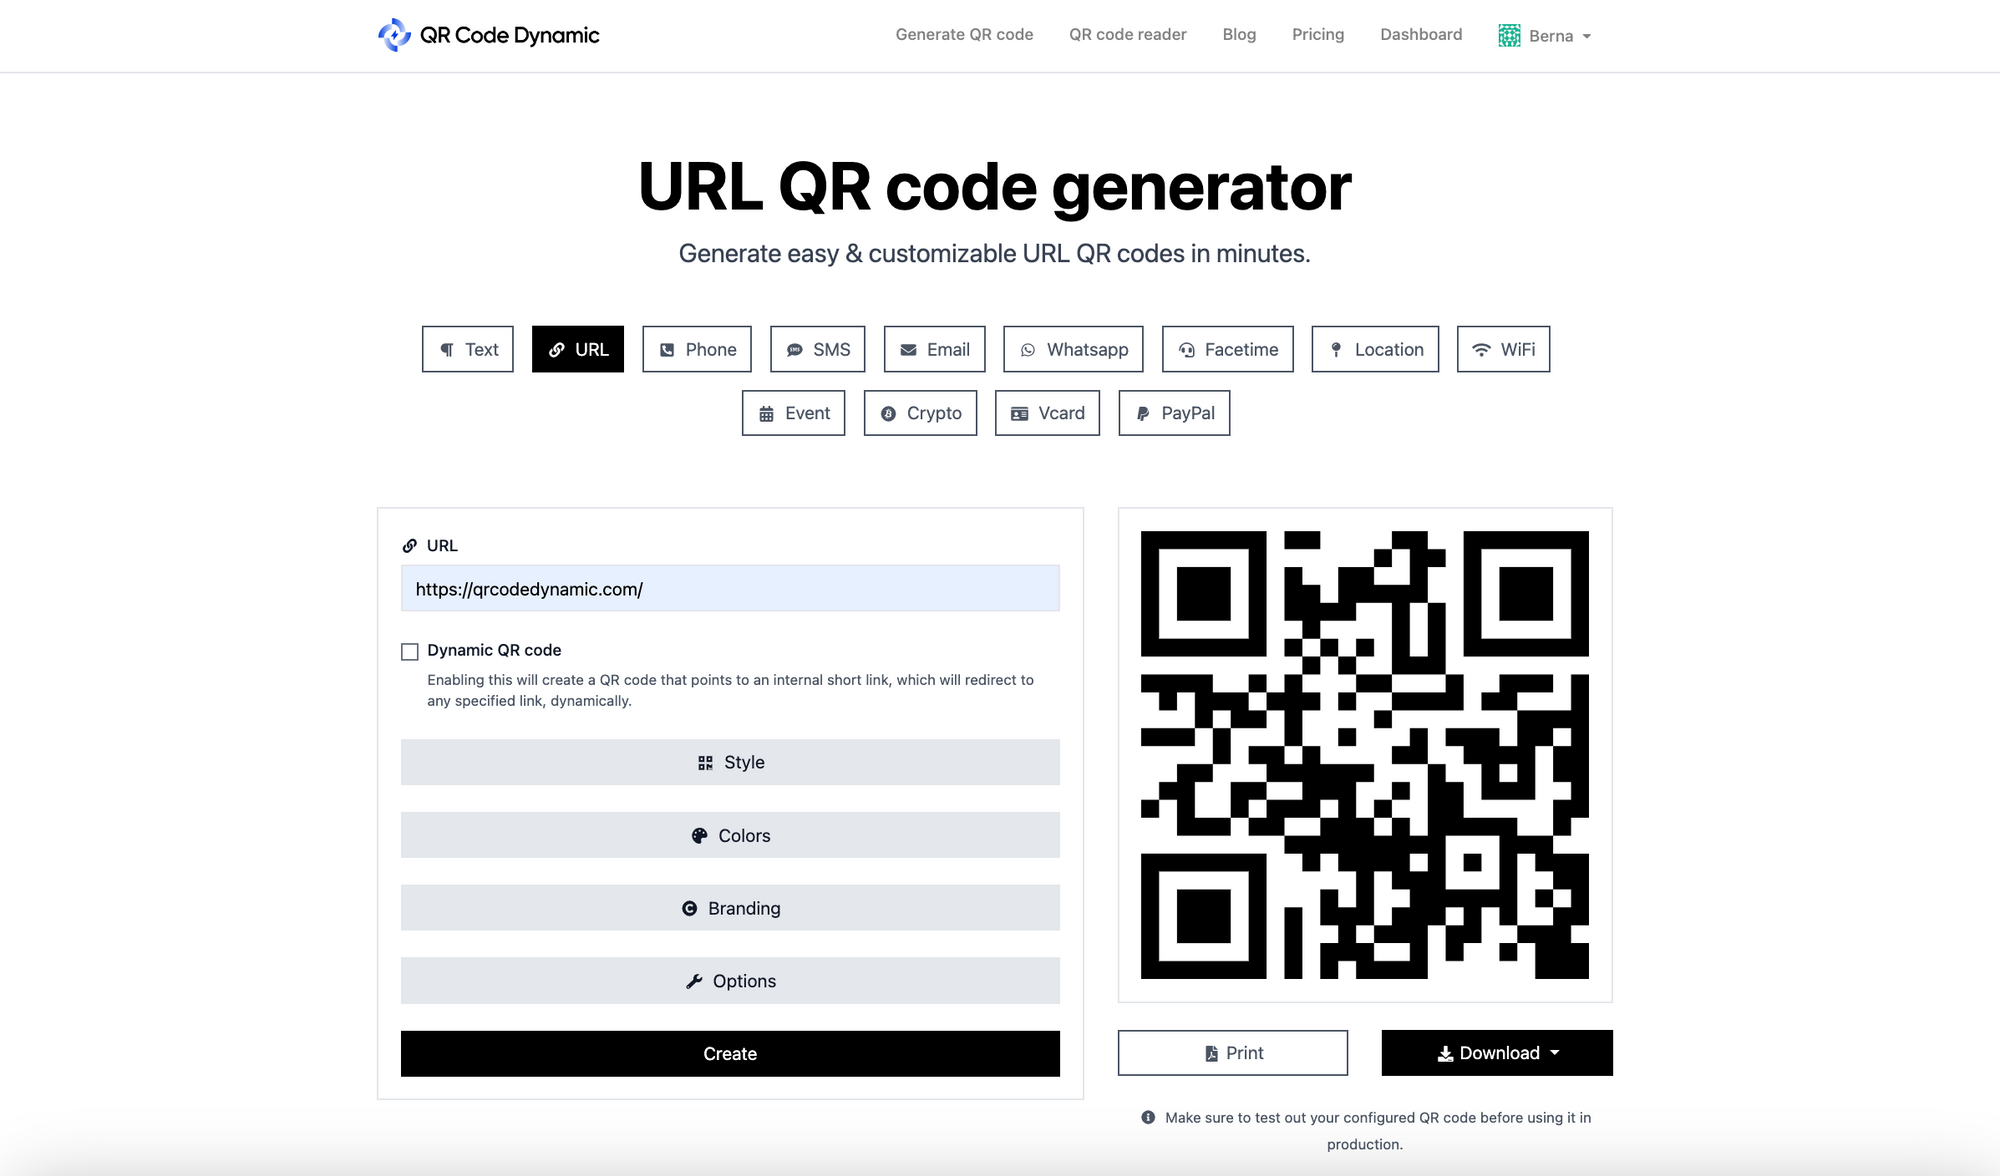
Step 3: Generate the QR code with the tagged URL
Paste the full UTM-tagged URL into the dynamic QR generator. The platform will create the short redirect, render the pattern, and let you customize colors, logo, and frame. Keep the contrast high (dark code on light background) and the quiet zone (white margin) at least four modules wide, or some scanners will fail.
Download a vector format (SVG or PDF) for print. PNG is fine for screens but gets blurry when scaled to billboard size.
Step 4: Distribute, and start collecting scans
Print, place, publish. The first scans should appear in your dashboard within minutes. Do a smoke test with your own phone before the campaign goes live — if the redirect isn't logging your test scan, something is misconfigured.
Step 5: Connect to GA4 for deeper attribution
Once scans are flowing, the GA4 side does the rest. Because every destination URL carries UTM parameters, every QR session shows up in GA4's Acquisition reports under the source and medium you set. Build a custom report filtered to medium = qr and you've got every QR-driven session, conversion, and revenue event in one view. For a step-by-step walkthrough, see our guide on how to track QR codes in Google Analytics.
UTM Parameters for QR Codes: the GA4 Bridge

UTM parameters bridge the offline scan and your analytics stack. Without them, GA4 treats a QR scan the same as a direct visit, and you can't compare QR against email, paid, and organic in one report.
The five UTM parameters are utm_source, utm_medium, utm_campaign, utm_content, and utm_term. For QR campaigns, the first four are enough. Set utm_medium=qr on every code, no exceptions, and you get a clean cross-campaign filter forever.
Two things to watch for:
- Use lowercase. GA4 treats
QRandqras separate values. Pick one and stick to it. - Don't pile parameters into the QR pattern. Let the redirect server handle the long URL. Your short URL stays short, the pattern stays scannable, and you can edit UTM values later without reprinting.
Common Metrics to Track, and What They Tell You

Dashboards are noisy. These are the metrics worth paying attention to.
Total scans vs unique scans
Total counts every event; unique deduplicates by device. The ratio between them tells you whether you're attracting new audiences or the same people coming back. A 1.0 ratio (every scan is unique) usually means high-traffic placement with first-time visitors. A 3.0 ratio means you've got a repeat-scan campaign — which can be great for loyalty plays and terrible for awareness budgets.
Scan-to-conversion rate
The percentage of scans that complete the action on the destination page (form fill, purchase, sign-up). This is the single most important number, and the one most marketers don't measure. According to QRLynx, only 12% of marketers actually connect scans to revenue, which means the other 88% are running campaigns blind. If you set up UTMs in Step 5, you're already in the 12%.
Average scans per campaign
Useful for budget conversations. Track this across campaigns and you'll quickly see which placements punch above their cost — a coffee-cup sleeve might out-scan a billboard if your audience is younger than your media planner.
Geographic distribution
City and region data tells you where your physical placements are actually working. If you printed 10,000 flyers in five cities and scans cluster in two, that's where you double down — and that's where you cut the next print run.
Device split
iOS vs Android matters for two reasons: the conversion path (deep links work differently on each), and the audience profile (iOS users skew higher-income in most US markets). If your destination is an app, this split tells you which store link to send first.
Time-of-day curves
Scans cluster around predictable hours. A restaurant menu code peaks at lunch and dinner. A commuter poster peaks at 8am and 6pm. Once you know your curve, you can time follow-up emails, retargeting ads, and inventory to match.
Common Mistakes That Quietly Kill QR Attribution
I see the same five mistakes across most teams new to QR tracking. They're all fixable in an afternoon.
- Using static codes for trackable campaigns. If the code was generated by typing your URL into a free generator and saving the PNG, it's almost certainly static. No scan log, no analytics. Regenerate the campaign with a dynamic provider and reprint.
- Forgetting UTM tagging. The QR platform sees the scan; GA4 sees a direct visit. Without UTMs, the two halves of the funnel never connect. Add UTMs to every destination URL before you generate the code.
- Not connecting QR scans to GA4 at all. The scan dashboard is fine for headline numbers, but you can't measure revenue inside it. The connection to GA4 is one UTM template away — there's no excuse to skip it.
- Ignoring repeat scans. Repeat scan rate is a quality signal. High repeats mean people keep coming back, which usually means the content behind the code is genuinely useful. Treat it as a retention metric, not a vanity stat.
- Not testing the scan-to-conversion path. Generate the code, scan it yourself, walk through the destination on a real phone. If the page is slow, the form is broken on mobile, or the deep link sends iOS users to the Play Store, you'll catch it before launch instead of after.
Privacy: What QR Code Tracking Does and Doesn't See
This deserves its own section because the answers aren't intuitive.
What QR tracking can see: the metadata an HTTPS request reveals — IP address (approximate location), device model, OS, time of scan, and sometimes a referrer if the scan came from a screen. None of this identifies anyone personally on its own.
What QR tracking can't see: name, email, contacts, photos, other apps, or what the user does after the redirect on a domain the QR provider doesn't own. The scan event ends at the redirect.
If the destination is your own site, normal cookie rules apply: respect consent banners, honor GPC signals, and don't collect what you don't need. Dynamic QR providers typically anonymize IPs after geo-resolution and don't link scans to individual identities, but specifics vary — read your provider's data policy before launching anything in regulated industries.
For most marketing use cases, QR scans are one of the least invasive forms of measurement available. You get aggregate behavioral data without asking the user to log in or hand over an email.
Frequently Asked Questions
How do trackable QR codes work?
Trackable QR codes work because the URL encoded into the pattern points to a redirect server rather than directly to your destination. Every scan hits that server first, gets logged with timestamp, location, and device info, and is then forwarded to the real destination. The code itself doesn't track anything — the server does. For the full breakdown, see our guide on trackable QR codes.
Can you track someone using a QR code?
Not in any meaningful personal sense. A QR scan reveals approximate location from IP (city-level, not street-level), device type, operating system, and timestamp. It doesn't reveal who scanned it, doesn't pull data from other apps, and doesn't continue tracking after the user leaves the destination page. If you need true identity-level tracking, you'd need the user to log in or submit a form on the destination — which is a normal web analytics flow, not a QR feature.
Can QR codes be traced back to you?
The QR creator can see aggregate scan data (counts, geography, device split), not who specifically scanned. The destination site can see whatever HTTPS reveals from any browser visit — IP, User-Agent, referrer — and can drop a cookie if the user accepts one. So in the same sense that any website visit "traces back" to the visitor, yes. Beyond that, no.
How do I track QR code scans?
Generate the code with a dynamic QR platform, tag the destination URL with UTM parameters, distribute the code, and check both the QR platform's dashboard (for scan-level metadata) and GA4 (for what happens after the scan). The QR dashboard tells you about the scan event. GA4 tells you about everything downstream — pageviews, conversions, revenue.
What analytics do QR codes provide?
Dynamic QR codes provide scan count (total and unique), timestamp, country/region/city, device type, operating system, and repeat scan rate. With UTM parameters layered on, you also get every downstream metric in your analytics stack: bounce rate, conversion rate, average order value, and lifetime value attributed back to the original scan source.
Pick the Tracking Setup That Matches Your Campaign Stakes
QR code tracking isn't complicated once you understand the mechanism: a dynamic code points to a redirect, the redirect logs the scan and forwards the user, and UTMs carry the campaign signal into GA4. The hard part isn't the technology. It's the discipline to tag every code consistently, to check the dashboard weekly, and to act on what the numbers actually say.
If you're just running a one-off poster, the QR platform's built-in dashboard is enough. If you're spending real money on print, packaging, or out-of-home, you need the GA4 connection so you can compare cost per scan against cost per click on every other channel. And if you're tracking physical assets, inventory, or anything operational rather than promotional, the playbook shifts — read our guide on QR code asset tracking or the use case for a QR code organization system for that side of the workflow.
Pick a dynamic platform, set your UTM template once, and the rest is repeatable.
Related reading: