How to Use QR Codes for Inventory Management in 2026 (Step-by-Step)


On this page
- How do you use QR codes for inventory management?
- Quick overview of the 7 steps
- What is a QR code inventory system?
- QR codes vs. traditional barcodes for inventory
- Side-by-side comparison
- How to set up QR codes for inventory management — step by step
- Step 1: Audit and clean your existing inventory data
- Step 2: Pick a dynamic QR code generator (not a static one)
- Step 3: Build the destination — spreadsheet, Airtable, or a WMS
- Step 4: Generate QR codes in bulk
- Step 5: Print and affix the labels
- Step 6: Train your team and run a pilot
- Step 7: Measure, iterate, and tie scans to ROI
- Best tools and software for QR code inventory
- Common mistakes to avoid with QR code inventory systems
- Measuring ROI of QR code inventory management
- Labor saved
- Errors avoided
- Shrinkage reduced
- Decisions made faster
- Pick your first QR inventory workflow
- Frequently asked questions
Manual stock counts eat hours, miscounts pile up, and the printed barcode label that worked in 2010 now holds back the whole warehouse. QR codes for inventory management fix that gap — they store more data, scan from any angle, and connect a $0.02 sticker to a cloud database your team can update from a phone.
How do you use QR codes for inventory management?
To use QR codes for inventory management, generate a unique dynamic QR code for each SKU, bin, or asset; link each code to a row in a live spreadsheet or inventory system; print and affix the labels; then scan with any smartphone to update stock counts, locations, and statuses in real time. Setup takes 2-3 hours for a 500-SKU pilot.
Quick overview of the 7 steps
1. Audit your current inventory data — pull a clean SKU list with locations, descriptions, and counts.
2. Pick a dynamic QR code generator — static codes can't be edited, so changes mean reprinting every label.
3. Build the destination — spreadsheet, Airtable, or WMS — this is where scans write data.
4. Generate codes in bulk — one code per SKU, bin, or asset.
5. Print and affix labels — pick the right material for the surface and environment.
6. Train your team and run a pilot — start with one aisle or category before scaling.
7. Measure, iterate, and connect to ROI — track scan volume, count accuracy, and time saved.
What is a QR code inventory system?
I've spent the last three years helping QR Code Dynamic customers replace barcode label printers, paper bin cards, and clunky scanner-only setups with phone-based QR workflows. The playbook below is the same one I walk new ops teams through, refined for what actually ships in 2026.
A QR code inventory system is a stock tracking setup where every item, bin, pallet, or asset gets a unique QR code label tied to a digital record. Scanning the code with a phone or scanner pulls up the item's data (SKU, location, quantity, supplier, expiry, photos) and lets the user update counts, transfers, and statuses on the spot.
The difference from a paper or barcode workflow is the link layer. The QR code itself doesn't store the inventory data — it stores a short URL that resolves to a live row in your database. Update the row, and every future scan reflects the change. No reprinting, no syncing delays.
According to Packem WMS, manual inventory tracking costs warehouses 20 to 40 hours per week and creates error rates as high as 25%. That's the gap a QR system closes — by replacing handwritten counts and re-keyed spreadsheet rows with a one-second scan.
For a deeper breakdown of how scan-based tracking handles bins, racks, and serialized assets, see our QR code asset tracking guide.

QR codes vs. traditional barcodes for inventory
Barcodes still work. They're cheap to print, every retail scanner reads them, and they're a known quantity for ops teams. But they're 1D — a single line of vertical bars storing roughly 20 characters of data. That's enough for a SKU number, and not much else.
According to Sortly, a single QR code holds more than 7,000 numbers — or 4,000 alphanumeric characters. The storage capacity of a QR code far exceeds the limitations of its predecessor, a one-dimensional barcode that holds 20 characters. In practice, that means a QR code can carry a SKU plus a bin location, supplier ID, batch number, expiry date, and a link to inspection photos. A 1D barcode can't.
Side-by-side comparison
| Capability | 1D Barcode | QR Code |
|---|---|---|
| Data capacity | ~20 characters | ~7,000 numeric / 4,000 alphanumeric |
| Scan direction | Single axis (horizontal) | Any angle, 360° |
| Reader required | Dedicated laser scanner (often) | Any smartphone camera |
| Damage tolerance | Fails if bars are scratched | Up to 30% damage and still readable |
| Editable destination | No — reprint to change | Yes, with dynamic QR codes |
| Cost per label | $0.005 - $0.02 | $0.01 - $0.03 |
| Built-in analytics | None | Scan logs, timestamps, locations |
Read our full breakdown in QR codes vs. barcodes and a closer look at 1D vs 2D barcode formats if you're choosing between symbologies.
How to set up QR codes for inventory management — step by step
This is the meat of the guide. Each step below is a specific action with the tools, settings, and pitfalls I see most often when teams roll out QR inventory for the first time.
Step 1: Audit and clean your existing inventory data
Before you generate a single QR code, your source data has to be trustworthy. A QR code pointing to a row with the wrong location or count just lets people scan their way to bad data faster.
Pull your current inventory into a spreadsheet with these columns at minimum: SKU, item name, current location (aisle/shelf/bin), unit of measure, on-hand quantity, supplier, reorder point. If you're tracking serialized assets (laptops, tools, equipment), add a serial number column.
1. Export from your current system (or paper records) into Google Sheets or Excel.
2. Sort by SKU and remove duplicates — these are the #1 cause of count mismatches after launch.
3. Standardize location names. "Aisle 3 Bin B" and "A3-B" referring to the same shelf will create two separate scan records.
4. Spot-check 20-30 random rows by walking the floor. If on-hand quantity is off for more than 10% of samples, do a physical recount before going further.
You'll know it's working when: your spreadsheet has one row per SKU, unique SKU values, no blank required fields, and at least one floor-walk confirms quantities are within 5% of physical counts.
Watch out for:
• Duplicate SKUs from variant tracking: Different colors or sizes often share a parent SKU. Treat each variant as its own row with a unique SKU suffix (e.g., SHIRT-001-RED-M).
• Free-text locations: If your old system let staff type "back room" or "shelf by window," fix this before scanning. A controlled location list saves weeks of cleanup later.
Pro tip: In my three years helping ops teams launch QR systems, the single biggest predictor of success isn't the tool — it's whether the data was clean on day one. One restaurant chain I worked with spent a week auditing 1,200 SKUs before printing labels, and they hit 99.2% count accuracy in the first month. Another skipped the audit and spent the first six weeks chasing phantom inventory.

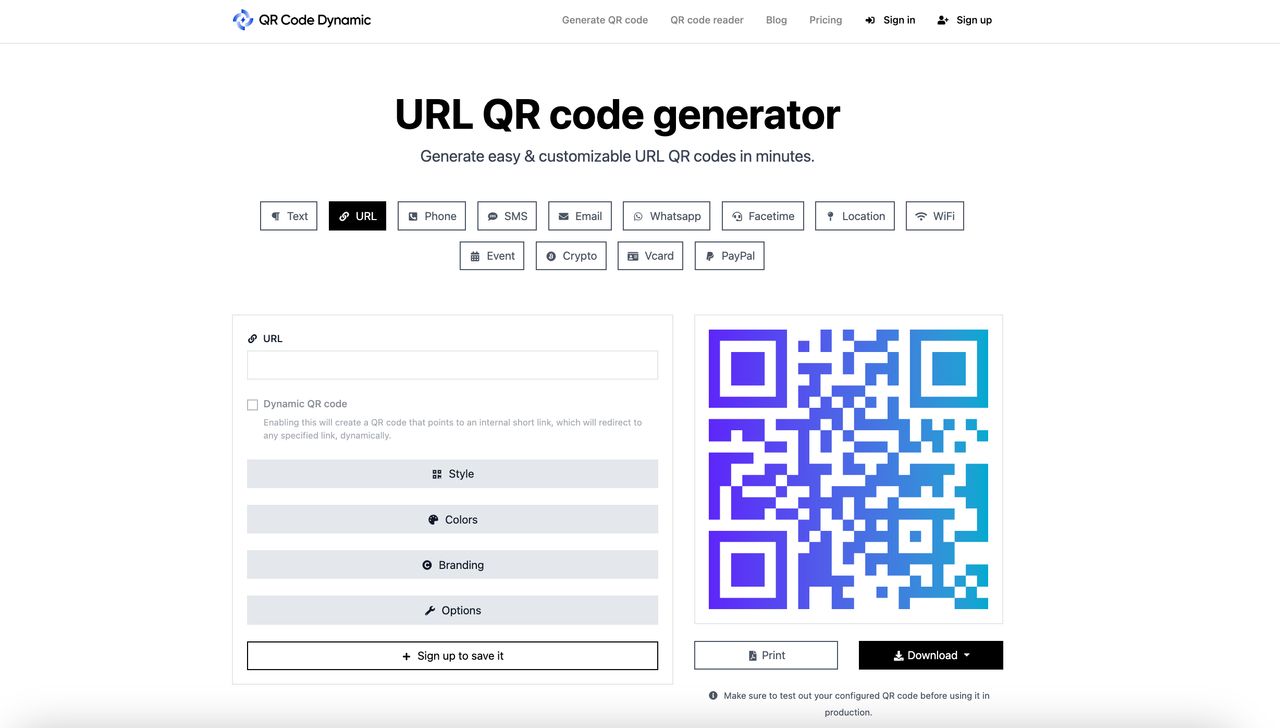
Step 2: Pick a dynamic QR code generator (not a static one)
This step decides whether you'll ever have to reprint your labels. A static QR code encodes the destination directly — change the destination, and you have to print and re-stick every code. A dynamic QR code stores a short redirect URL; the destination lives in the generator's dashboard and can be edited any time.
For inventory, dynamic is the only practical choice. Bin locations get reshuffled, suppliers change, item descriptions need updates. Dynamic codes survive all of that.
1. Sign up for QR Code Dynamic or another dynamic QR provider that supports bulk creation.
2. Choose the URL or text code type — for inventory, URL is what you want, since it'll point to a row in your spreadsheet or inventory app.
3. Enable scan analytics if available — you'll want scan counts and timestamps per code later.
4. Check that the generator supports CSV bulk upload — you'll need this in Step 4.
For a longer comparison, our static vs dynamic QR codes writeup covers the trade-offs in detail.
You'll know it's working when: you can create a test code, scan it with your phone, then change its destination URL in the dashboard and re-scan the same printed code to land on the new page.
Watch out for:
• Free generators that quietly switch to static after a trial: A code that worked yesterday suddenly can't be edited. Verify the dynamic feature is included in the plan you're using, not a 14-day trial.
• Generators with no scan logs: If you can't see when a code was last scanned, you lose the ability to spot dead labels or unused SKUs.
Pro tip: Generate one test code and stick it on a coffee mug for a week before committing. Scan it daily. Edit the destination once. If anything about the flow feels slow or confusing for that one code, multiply that pain by 500 SKUs and pick a different tool.
Step 3: Build the destination — spreadsheet, Airtable, or a WMS
Every QR code needs somewhere to land. The "destination" is what the scanner sees after the redirect resolves. For most small and mid-sized operations, this is one of three things:
• Google Sheets or Excel: Each SKU is a row. The QR code links to a filtered view of that row. Free, familiar, and fast to set up. Best for under 1,000 SKUs and low-concurrency teams.
• Airtable, Notion, or Coda: Same idea, but with better mobile UI, attached photos, and form-based updates. Best for 1,000-10,000 SKUs and teams that want a polished scan experience.
• A dedicated inventory or warehouse management system (Sortly, Cin7, Fishbowl, NetSuite): Built-in QR code generation, mobile apps, multi-location support, integrations with accounting and shipping. Best for 10,000+ SKUs or anyone with serial number tracking, FIFO rules, or audit requirements.
1. Pick one based on SKU count and team size.
2. Create your master inventory table with the columns from Step 1.
3. For Sheets and Airtable, build a per-row "detail view" URL. In Airtable, each record has a shareable view link. In Google Sheets, you can use a query parameter URL like https://docs.google.com/spreadsheets/d/SHEET_ID/edit#gid=0&range=A5.
4. Test the destination URL on a phone — it should load fast and show the right row without making the user pinch-zoom or scroll horizontally.
You'll know it's working when: you can paste any per-SKU URL into your phone browser and land directly on that item's details in under 3 seconds.
Watch out for:
• Permission walls: If the Sheet requires Google sign-in and your warehouse phones aren't logged into the company account, every scan will hit a login screen. Use "Anyone with the link can view" — or better, "comment" — for the inventory sheet.
• Mobile-unfriendly destinations: A 20-column spreadsheet view is unreadable on a phone. Build a mobile-optimized form or filtered view first.
Pro tip: For teams under 500 SKUs, Airtable hits the sweet spot. I helped a boutique homeware shop set up a 320-item system in Airtable in one afternoon — each scan opens a clean record with on-hand count, supplier, restock date, and an "Update" button. The shop's owner did the entire monthly count in 90 minutes, down from a six-hour Sunday.

Step 4: Generate QR codes in bulk
Generating codes one by one is fine for ten SKUs. For 200 or 2,000, you need bulk creation. Most dynamic QR platforms accept a CSV with two columns: a label/name and a destination URL.
1. Build a CSV: column A is the SKU (this becomes the code's internal name), column B is the destination URL for that SKU.
2. Upload to your QR generator's bulk-create endpoint.
3. Download the resulting QR codes as a ZIP — usually PNG or SVG files, each named after its SKU.
4. Spot-check 10 random codes by scanning them on your phone. Each should resolve to the right SKU's record.
If you have engineering resources, the QR Code Dynamic API lets you create codes programmatically, which is useful if SKUs are added or retired weekly.
You'll know it's working when: 10 random scans resolve to the correct SKU records, and your local ZIP contains one file per row of your CSV.
Watch out for:
• Off-by-one CSV errors: A misaligned header row creates codes that all point to the wrong SKU. Always test 10 random codes — first, last, and 8 in the middle — before printing thousands.
• URL length cutoffs: Some generators truncate long URLs. Use a URL shortener or your generator's redirect feature; don't paste 200-character spreadsheet URLs raw.
Pro tip: Name each code with its SKU plus a one-character location prefix — e.g., "W-SHIRT001" for warehouse, "S-SHIRT001" for store. Six months in, when you're auditing dead codes, the prefix tells you immediately where it should live.

Step 5: Print and affix the labels
The right label material matters more than people expect. A glossy sticker on a cold-storage freezer rack peels off in two weeks. A matte paper label on a sweaty restaurant prep station smudges before the lunch rush.
1. Pick label stock based on environment: matte polyester for warehouses, vinyl with UV-resistant coating for outdoor or freezer use, plain paper for desk/office inventory.
2. Size codes at minimum 20mm × 20mm for phone scanning from 30cm away. Bump to 30mm × 30mm if scanners will work from a meter or more.
3. Print using a thermal label printer (Brother QL-820NWB, DYMO LabelWriter) for short runs, or order pre-printed sticker sheets from a print service for runs over 1,000.
4. Affix each label flat — curved or wrinkled surfaces hurt scan speed. Leave a 5mm quiet zone (white space) around each code.
You'll know it's working when: A team member can scan any label in under 2 seconds from a comfortable arm's length, and the labels don't smudge or peel after a week of normal handling.
Watch out for:
• Too small to scan: A 10mm code looks fine on paper but fails repeatedly under warehouse lighting. Stick to 20mm minimum.
• Wrong adhesive for the surface: Standard sticker glue won't hold on textured plastic bins or powder-coated metal. Ask your label vendor for "industrial" or "removable strong" adhesive.
Pro tip: Buy 50 sample labels from three different vendors before ordering a full batch. I had a client order 5,000 labels from the cheapest vendor — by week three, 40% had peeled off in a humid back room. The reprint cost more than the original premium-vendor quote.

Step 6: Train your team and run a pilot
The fastest way to kill a QR rollout is to drop labels on every shelf overnight and expect the team to figure it out. Pilot one aisle or category first. Get feedback. Then scale.
1. Pick a single zone: one aisle, one cooler, one supply closet — whatever has 50-200 SKUs.
2. Run a 30-minute team walk-through. Show how to scan, how to update counts, how to log a damaged item, how to flag a missing one.
3. Have each team member do five live scans while you watch.
4. Run the pilot for 5-10 business days. Don't add new zones during this window.
5. Collect feedback in a shared doc: what was confusing, what took longer than expected, what they wished worked differently.
You'll know it's working when: the pilot zone's count accuracy matches a physical recount within 2%, and every team member can complete a scan-and-update cycle in under 15 seconds without help.
Watch out for:
• Skipping the recount: If you don't verify the pilot zone against a physical count, you'll never know whether the QR data is right.
• Adding zones too early: Each new zone introduces new variables (lighting, label placement, traffic patterns). One zone at a time until each is stable.
Pro tip: Make the pilot zone the highest-turnover area you have — fast-moving consumables, top-selling SKUs, the receiving dock. If the system handles peak chaos, the slower zones will be easy. If you pilot in the quiet supply room, you'll learn nothing useful about real-world scans.

Step 7: Measure, iterate, and tie scans to ROI
A QR system that nobody measures is just a sticker collection. Pull scan data weekly for the first month, monthly after that. The numbers tell you whether the system is earning its keep.
1. In your QR dashboard, export scan logs: code, timestamp, device type, location (if geolocation is enabled).
2. Track four KPIs week over week:
• Scan volume per zone: Are codes being used? Zero scans = dead code.
• Count accuracy: Quarterly physical recount vs system count, per zone.
• Time to complete a stock count: Before vs after.
• Shrinkage rate: Lost/missing inventory as a % of total stock value.
3. Flag any code with zero scans in 60 days. Either the location is wrong, the label is damaged, or the SKU is dead.
4. Reissue or relocate problem codes monthly during the first quarter.
You'll know it's working when: count accuracy hits 98%+ within three months, stock-count time drops by at least half, and shrinkage falls meaningfully against the pre-QR baseline.
Watch out for:
• Ignoring zero-scan codes: A code that's never been scanned is doing nothing. Either the SKU isn't moving (delist it) or the code is broken (replace it).
• Vanity scan metrics: Total scans is less useful than scans per zone per week. One overscanned code in receiving doesn't mean the system is healthy.
Pro tip: Set a 60-day calendar reminder for a "scan log review." It takes 20 minutes and almost always uncovers 5-10 codes that need attention. The teams that do this hit 99% accuracy in six months. The teams that don't drift back toward 92% within a year.

Best tools and software for QR code inventory
The right tool depends on three things: how many SKUs you have, whether you need multi-location support, and how much your team will tolerate a learning curve.
| Tool | Best for | Pricing | QR features |
|---|---|---|---|
| QR Code Dynamic | Generating dynamic, trackable codes at any scale | Free tier + paid plans from low monthly cost | Bulk creation, scan analytics, API access, editable destinations |
| Sortly | SMBs with 500-10,000 SKUs needing a mobile-first WMS | Free for up to 100 entries; paid from $29/mo | Built-in QR/barcode scanning, photo records, multi-user |
| Airtable | Teams wanting a customizable database with mobile views | Free + paid from $20/user/mo | QR field type, mobile forms, integrations with QR generators |
| Google Sheets + QR Code Dynamic | DIY teams under 500 SKUs on zero budget | Free | Bring-your-own QR + per-row spreadsheet destinations |
| Fishbowl | Manufacturers and wholesalers needing full WMS | From $329/mo | Native barcode + QR support, multi-warehouse, lot tracking |
If you're starting from scratch, my honest take: try QR Code Dynamic paired with Airtable or Google Sheets for the first three months. It's enough capability to validate the workflow without committing to a $300/month WMS contract. Move up the stack only after you've outgrown the spreadsheet.
Common mistakes to avoid with QR code inventory systems
Most failed rollouts I see come back to the same handful of mistakes. Avoiding them is cheaper than fixing them.
• Using static codes for editable data: Static codes can't be updated. If you choose static, every supplier change, bin reshuffle, or item description edit means reprinting the label. Use dynamic from day one.
• Skipping the data audit: Bad source data gets faithfully reproduced by the QR system. Clean before you print.
• Labels too small or in the wrong material: 10mm codes on glossy stickers in a freezer = failed scans every day. Spec the material to the environment.
• No training: Teams that get a 30-minute walk-through hit 95% accuracy. Teams that don't drift to 80% and start blaming the system.
• Treating it as a one-time project: Inventory shifts constantly. Without a monthly scan-log review, dead codes pile up and accuracy decays.
• Storing data inside the QR code instead of behind it: Static codes that encode an SKU directly look fine on day one but lock you out of analytics, updates, and integrations. Always point the QR at a database row, not a static string.
• Linking to mobile-unfriendly destinations: A 20-column desktop spreadsheet on a phone screen kills adoption. Mobile-optimize the destination view before you print labels.
Measuring ROI of QR code inventory management
ROI for a QR system breaks into four categories: labor saved, errors avoided, shrinkage reduced, and decisions made faster. Each has a number you can put on a spreadsheet.
According to Krofile, one study showed 43% of businesses use QR codes for logistics tracking and 39% for inventory management. The teams measuring outcomes — not just adopting the tool — are the ones reporting double-digit operational gains.
Labor saved
Track time-per-count before and after. Most operations report a 50-75% reduction in monthly stocktake time once teams are trained. A 4-hour count that drops to 1 hour, run monthly, saves 36 hours per year per team. At a $25/hour loaded labor cost, that's $900/year per team — before counting any error-correction time saved.
Errors avoided
Manual counts have error rates that climb with volume. A QR-based count writes directly to the database with no re-keying. Track miscount rate: physical recount vs system count, sampled quarterly. A drop from 8% to 1% miscount rate on $200,000 of inventory frees up ~$14,000 of misallocated working capital.
Shrinkage reduced
Real-time tracking surfaces missing items faster, which makes patterns visible: which shelves, which shifts, which suppliers. Pre/post shrinkage rate is the cleanest KPI. Operations I've worked with typically see 20-40% lower shrinkage in the first six months after launch — not because QR codes prevent theft, but because daily scans make discrepancies obvious within hours instead of weeks.
Decisions made faster
Harder to quantify, but real. With live scan data, reorder decisions happen on Mondays, not after the monthly count. Out-of-stock events drop. Buying happens in smaller, smarter batches. Track stockout frequency and inventory turnover before vs after launch.
Pick your first QR inventory workflow
The single biggest barrier to a QR inventory rollout isn't tooling. It's overthinking the first step. Pick one zone, audit its data, generate codes for those SKUs, print 50 labels, and run a one-week pilot. That's it. Everything else — bulk generation, API integrations, multi-location dashboards — builds on top of that working pilot.
If you're ready to start, head over to QR Code Dynamic to generate your first dynamic codes free, then pair them with a spreadsheet or Airtable base. Once your pilot is stable, our QR code organization system guide walks through scaling to multiple zones, and our trackable QR codes guide covers scan analytics in depth.
If you'd rather skip QR entirely and stay with barcodes, that's a valid choice too — read our barcode inventory system overview and barcode types guide first to make sure the format fits your workflow.
Frequently asked questions
How do QR codes improve inventory accuracy?
QR codes improve accuracy in three ways. First, scanning eliminates re-keying — the leading cause of count errors. Second, every scan writes to a single source of truth, so two team members in two locations can't accidentally record conflicting counts. Third, scan logs create an audit trail: when a count looks off, you can see exactly when and where each scan happened. Operations that switch from paper to QR typically see miscount rates drop from 5-25% down to 1-2%.
What tools integrate with QR code inventory systems?
Common integrations include accounting platforms (QuickBooks, Xero), e-commerce systems (Shopify, WooCommerce), ERP suites (NetSuite, SAP Business One), shipping software (ShipStation, Shippo), and project tools (Airtable, Notion). The pattern that works best: use a dynamic QR generator like QR Code Dynamic for the labels, a database like Airtable or a dedicated WMS for the inventory records, and Zapier or native API webhooks to push scan events into accounting or shipping systems. The QR layer stays simple while the data flows where you need it.
Can I use QR codes for inventory in Excel or Google Sheets?
Yes. The simplest setup uses Google Sheets or Excel as your inventory database, with each row containing one SKU's data. Generate dynamic QR codes via QR Code Dynamic, point each code to a per-row URL or filtered view, and let staff scan with any phone to view or update. This works well for operations under 500-1,000 SKUs. Past that, a dedicated platform like Airtable or Sortly handles concurrency and mobile UI better.

I work as a Growth Marketer at Popupsmart, using my 3+ years of SaaS experience to create clear, useful marketing content that helps brands grow, reach the right audiences, and improve their results.