


To track QR codes in Google Analytics, point each code to a URL tagged with UTM parameters (source, medium, campaign). GA4 can't see the scan itself, but when someone lands on that tagged page, GA4 records the session with your campaign data. Open Reports > Acquisition > Traffic acquisition to see scans, sessions, and conversions per code.
What you'll need: A Google Analytics 4 property installed on your destination page (the gtag or GTM snippet must already be firing)A QR code generator that lets you encode a full URL, ideally a dynamic one so you can edit the destination laterAbout 30 minutes for first-time setup, 10 minutes per code after thatSkill level: beginner-friendly, no code required
Quick overview of the process:
- Build a UTM-tagged destination URL — add source, medium, and campaign tags with Google's Campaign URL Builder.
- Encode that URL in a QR code — use a dynamic code so you can fix typos or swap pages without reprinting.
- Confirm GA4 is firing on the landing page — check the Realtime report with a test scan.
- Read performance in Traffic acquisition — filter by your campaign name to isolate each code.
- Connect scans to conversions and events — tie sessions to sign-ups, purchases, or key events.
I've set up QR tracking for print runs, event banners, and product packaging over the past few years, and the part that trips people up isn't GA4 itself. It's understanding what GA4 actually measures. Let's clear that up, then walk through the full setup.
What Is QR Code Tracking?
QR code tracking is the practice of measuring what happens after someone scans a QR code: how many scans you got, where and when they happened, what device people used, and what they did on the page that loaded. It turns a static printed square into a measurable marketing channel.
Here's the technical reality most guides gloss over. A standard QR code is just an encoded URL. The scan happens inside the phone's camera app, which Google Analytics never sees. What GA4 does see is the page visit that follows. Tag that destination URL correctly and every scan-driven visit shows up as a session with your exact source, medium, and campaign attached.
There are two layers of tracking worth separating:
- Scan-level analytics — the raw count of scans, plus location, time, and device. You only get this from a dynamic QR code platform that logs the redirect, because GA4 can't count a scan that never reaches your site.
- Behavior-level analytics — sessions, engagement, events, and conversions after the visit lands. This is GA4's job, powered by your UTM tags.
Used together, you get the full picture: how many people scanned, and what those scans were worth. Our guide to trackable QR codes covers the scan-logging layer in more detail.
Why Track QR Codes in Google Analytics 4?
Because a scan count alone tells you almost nothing about value. GA4 connects an offline touchpoint, your poster or flyer or package, to the online behavior that actually drives revenue: sign-ups, demo requests, purchases.
QR codes are no longer a niche tactic, which raises the stakes on measuring them properly. According to the State of QR Codes 2026 report, 71% of consumers say QR codes are useful in their daily lives and 98% of marketers report a positive impact on their marketing over the past year. When that many people are scanning, the question shifts from "should we use QR codes" to "which codes are actually working."
Adoption keeps climbing too. According to ScanQueue's adoption data, 89 million Americans scanned a QR code in 2025, projected to pass 100 million in 2026. Pairing that volume with GA4 gives you what a standalone scan counter can't: attribution to the exact printed asset, conversion data (how many scans became key events, so you can cost out offline media), audience insight from GA4's demographics and device reports, and a direct comparison of QR traffic against email, paid, and organic in one place.
One honest caveat: GA4 attributes the visit, not the scan. If someone scans but never loads the page (slow connection, they bail), GA4 won't log it. That gap between scans and sessions is itself a useful diagnostic, and I'll show you how to read it later.
How to Track QR Codes in Google Analytics (Step-by-Step)
Here's the full setup, in the order I run it for every new campaign. Static or dynamic, the GA4 side is identical; the difference is whether you can edit the code afterward.
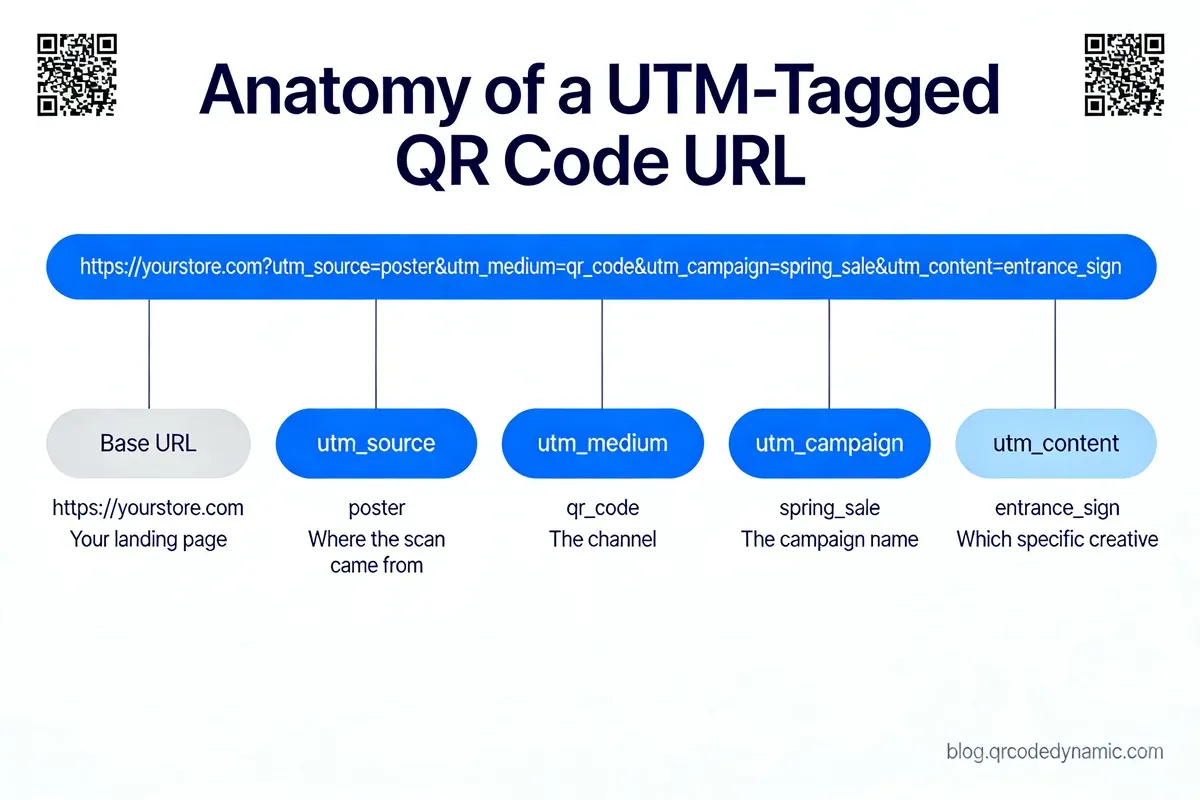
Step 1: Build a UTM-Tagged Destination URL
This is the step that makes everything else work. Before you touch a QR generator, you build the URL the code will point to and tag it with UTM parameters so GA4 can attribute the visit. Skip this and GA4 lumps your scans into "direct" or "unassigned" traffic, which is the single most common QR tracking failure.
Use Google's Campaign URL Builder to assemble it without typos:
- Enter your website URL (the page you want scanners to land on, e.g.
https://yourstore.com/summer-sale). - Set campaign source to the physical placement, like
storefront-posterorproduct-box. - Set campaign medium to
qr_codeso all QR traffic groups together (use this exact value every time). - Set campaign name to the specific initiative, like
summer_sale_2026. - Optionally add campaign content to A/B test placements, like
windowvsregister.
Your finished URL looks like https://yourstore.com/summer-sale?utm_source=storefront-poster&utm_medium=qr_code&utm_campaign=summer_sale_2026.
You'll know it's working when: the builder outputs a single long URL with all your utm_ tags visible at the end. Copy it exactly, don't retype it.
Watch out for:
- Inconsistent casing: GA4 treats
QR_Codeandqr_codeas two separate mediums, splitting your data across two rows. Pick lowercase with underscores and never deviate. I keep a one-line text snippet of my naming convention pinned so the whole team uses the same values. - Spaces in values: a space breaks the URL. Use underscores or hyphens, never raw spaces.
Pro tip: I keep a shared spreadsheet of every UTM combination I've printed. When I reused one poster design across two cities, the log let me append utm_content=austin vs utm_content=denver and compare the same creative by market. Without that record, the two cities would have collapsed into one indistinguishable row in GA4.
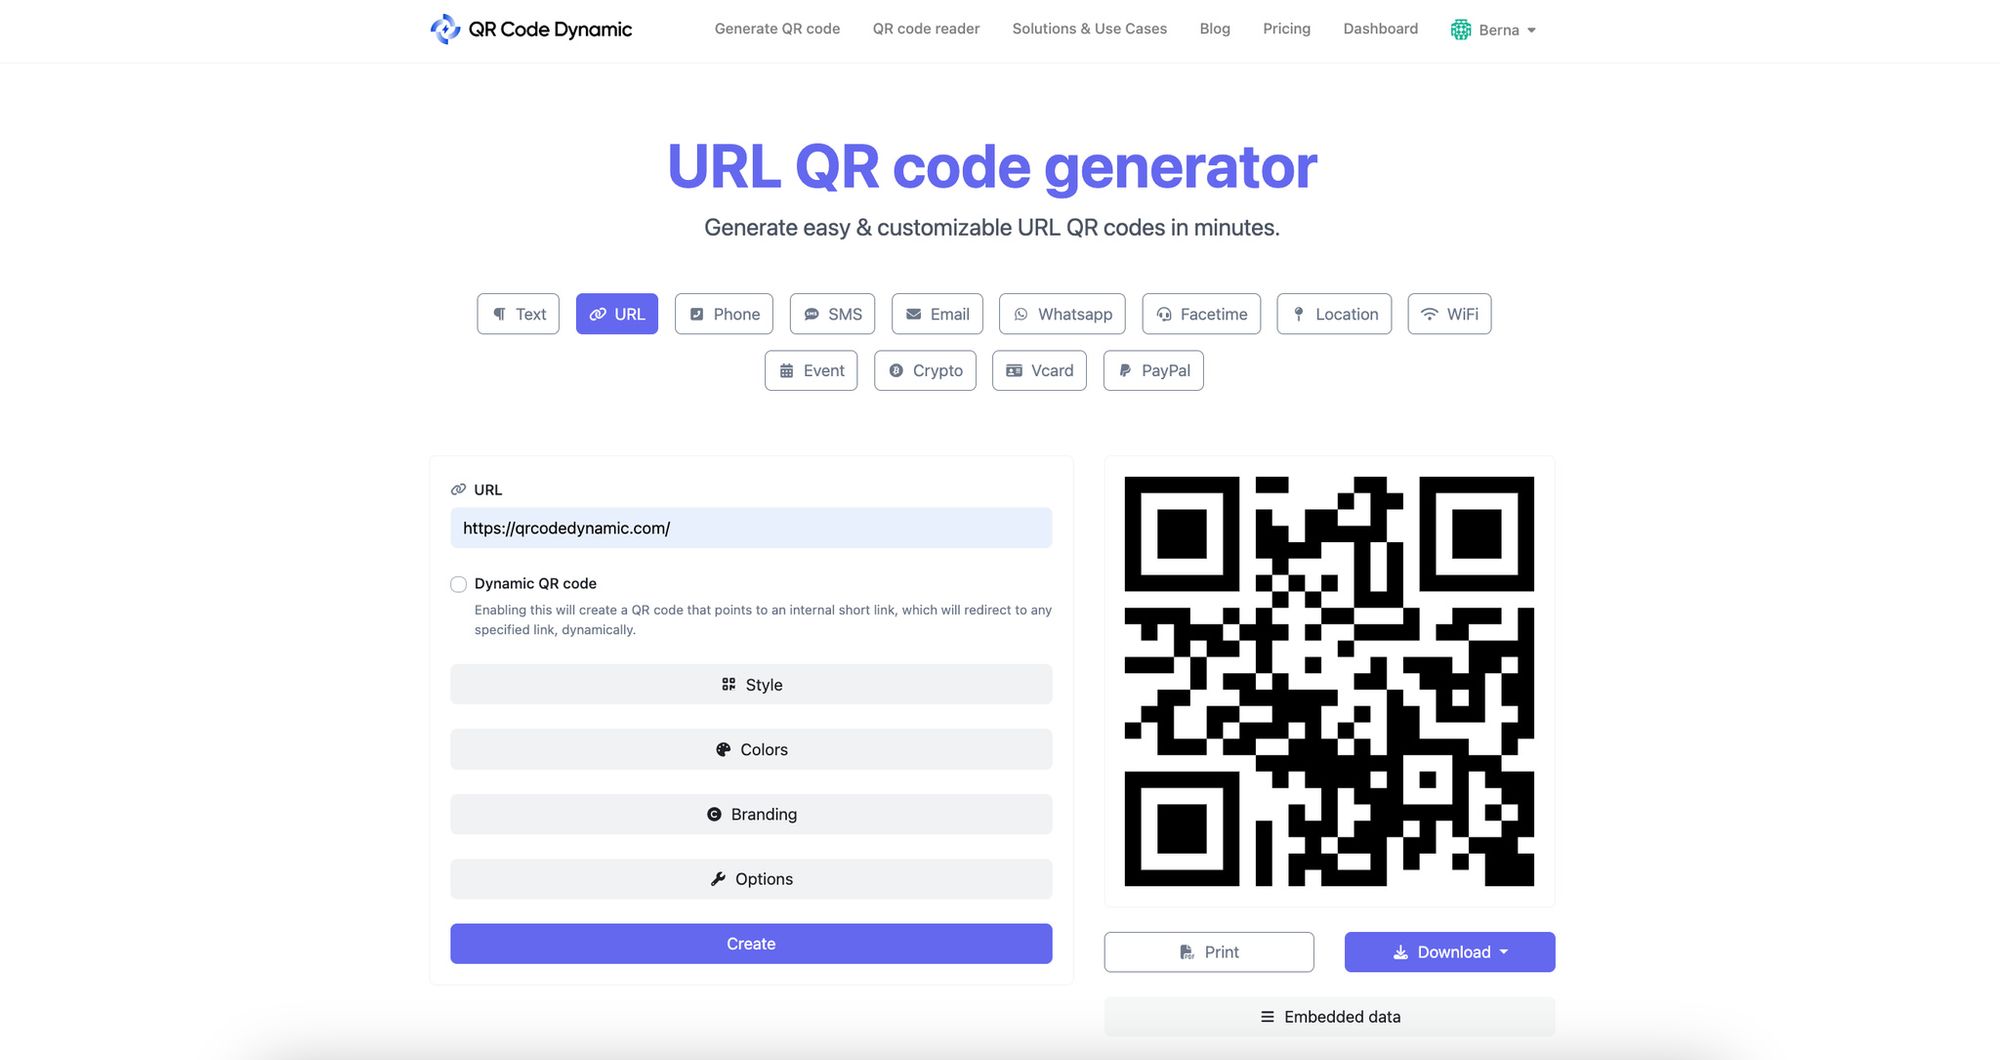
Step 2: Encode the URL in a QR Code
Now you turn that tagged URL into a scannable code. Any generator that accepts a full URL will technically work, but a dynamic code is worth it the moment you print anything you can't easily reprint.
- Open a QR code generator and choose the URL type.
- Paste your full UTM-tagged URL from Step 1 into the destination field.
- Set error correction to at least level Q (25%) if you plan to add a logo or print at a smaller size.
- Download the code as SVG or high-resolution PNG for print so it stays crisp at scale.
You'll know it's working when: you scan the code with your own phone and it opens the correct page with the ?utm_ string still attached in the address bar.
Watch out for:
- Static codes you can't fix: a static QR code bakes the URL permanently into the pattern. If you typo a UTM value or the landing page moves, the printed code is dead. Dynamic codes store a short redirect URL in the pattern and let you change the destination anytime, no reprint. That alone is why I default to dynamic for anything going to print.
- Printing too small: a code that won't scan logs zero sessions and looks like a tracking failure. Check our notes on minimum QR code size before you send artwork to the printer.
Pro tip: Always test the printed proof, not just the on-screen file. I once approved a code that scanned fine on my monitor but failed on the glossy postcard, where print glare and a trimmed quiet zone killed it. Now I scan every proof under store lighting before sign-off.
Step 3: Confirm GA4 Is Firing on the Landing Page
Before you print thousands of copies, verify GA4 actually records the visit with your UTM data. This is the cheapest insurance in the whole process, and it takes two minutes.
- In GA4, open Reports > Realtime.
- Scan your test code from a phone that's not on the office Wi-Fi (use cellular so it counts as an external visit).
- Watch the Realtime card populate, then add a secondary dimension of Session source / medium.
- Confirm your visit appears as
storefront-poster / qr_coderather than(direct) / (none).
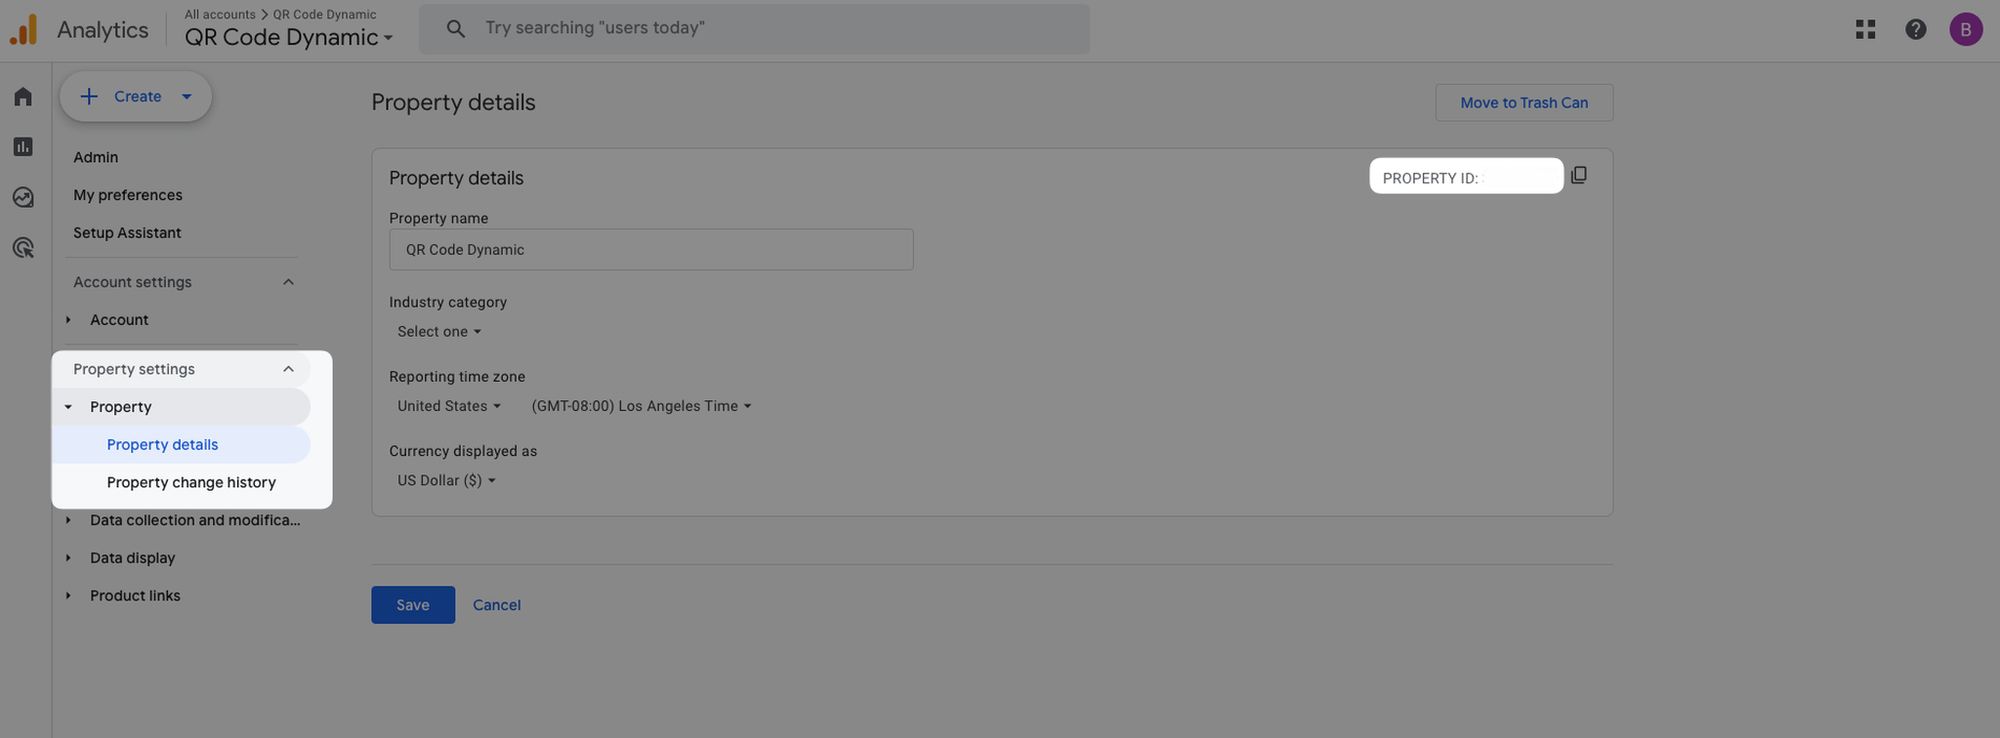
If you want the property and data stream details handy, you'll find them under Admin > Property > Data streams, where your Measurement ID (the G-XXXXXXX value) lives.

You'll know it's working when: your test scan shows up in Realtime within about 30 seconds, tagged with your exact source and medium.
Watch out for:
- Testing on the same network: internal IP filters can suppress your own visits, making it look broken when it isn't. Use mobile data for the test.
- UTM tags stripped by a redirect: if your landing page bounces visitors through another URL (say, an http-to-https redirect or a regional splitter), the UTM string can get dropped before GA4 reads it. Test the exact final URL and make sure the parameters survive every hop.
Pro tip: I run the Realtime test on both iOS and Android, because their default browsers handle redirects differently. On one campaign, an iOS app-based scanner stripped the UTM string while Android preserved it. Catching that early saved a quarter of the data on a 5,000-piece mailer.
Step 4: Connect Scans to GA4 Events and Conversions
Sessions are useful, but the real payoff is tying scans to actions: a purchase, a form fill, a booking. GA4's event model makes this straightforward once your UTM-tagged traffic is flowing.
- Decide which on-page action equals success (e.g.
generate_lead,purchase, or a custom event likebooking_confirmed). - In Admin > Events, confirm the event is being collected, or create it with GA4's "Create event" rule.
- Mark it as a key event (GA4's replacement for the old "conversion" toggle).
- In any report, add Session campaign as a dimension and your key event as the metric to see conversions per QR campaign.
This is where offline media finally earns a real ROI number. According to a QR campaign case study documented by Holtz Communication, a tracked print campaign produced a 3.2% response rate from 148 respondents, the kind of figure you can only calculate once scans are tied to a measurable action rather than counted in isolation.
You'll know it's working when: your key event count shows real numbers in the same report row as your QR campaign source and medium.
Watch out for:
- Forgetting to mark the event as a key event: if you skip the toggle, the action still records but won't appear in conversion-focused reports or the Advertising workspace.
- Attribution windows hiding delayed conversions: someone scans a package today and buys next week. Check the default attribution settings under Admin > Attribution settings so longer consideration cycles still credit the QR touchpoint.
Pro tip: For high-value print, I add a dedicated utm_content value per production batch. On a packaging refresh, this showed batch two converting 40% lower, which traced back to a darker box color hurting scan reliability. Pure session counts would never have surfaced that.
Adding UTM Parameters to QR Codes
UTM parameters are the connective tissue between a physical scan and GA4. They're small tags appended to your URL that tell Analytics where the visit came from. Get the structure right once and every report downstream just works.
A complete tag set has up to five parameters. Three are essential for QR tracking; two are optional but powerful:
| Parameter | What it answers | Required? | QR example |
|---|---|---|---|
utm_source | Where the code is placed | Yes | storefront_window |
utm_medium | The channel type | Yes | qr_code |
utm_campaign | The specific initiative | Yes | spring_launch_2026 |
utm_content | Which version or placement | Optional | aisle_endcap |
utm_term | Keyword (rarely used for QR) | Optional | — |
Two rules keep your data clean. First, standardize utm_medium to one value, I use qr_code everywhere, so all QR traffic rolls up into a single channel you can isolate. Second, make utm_source describe the physical location, because that's the offline-attribution detail GA4 can't infer on its own.
Campaign-Specific UTM Tagging
The power move is varying parameters across placements so you can compare them. Say you're running one promotion across three surfaces:
- Poster:
?utm_source=mall_poster&utm_medium=qr_code&utm_campaign=spring_launch_2026 - Flyer:
?utm_source=street_flyer&utm_medium=qr_code&utm_campaign=spring_launch_2026 - Packaging:
?utm_source=product_box&utm_medium=qr_code&utm_campaign=spring_launch_2026
Same campaign, same medium, different sources. In GA4 you'll see one campaign total broken down by the three placements, so you know whether the poster or the packaging actually drove conversions. If you're putting codes on physical signage, our breakdown of QR codes on posters pairs naturally with this tagging approach.
Dynamic vs Static QR Codes for Analytics
This choice shapes how much tracking you actually get, so it deserves its own table.
| Capability | Static QR code | Dynamic QR code |
|---|---|---|
| Edit destination after printing | No | Yes |
| Built-in scan count | No | Yes |
| Scan location & device data | No | Yes |
| Works with GA4 via UTM | Yes | Yes |
| Fix a UTM typo without reprinting | No | Yes |
Both feed GA4 the same way, through the tagged URL. But only a dynamic code adds the scan-level layer GA4 can't capture, and only a dynamic code lets you correct a mistake after the artwork ships. According to the QR codes market analysis from Market.us, the market is projected to grow from $18.6 billion in 2025 to roughly $89 billion by 2034, and the editable, trackable dynamic format is the part of that growth doing the heavy lifting for marketers.
Viewing QR Code Performance in GA4
Once codes are live, all your QR data lives in the acquisition reports. Here's exactly where to look and what each number means.

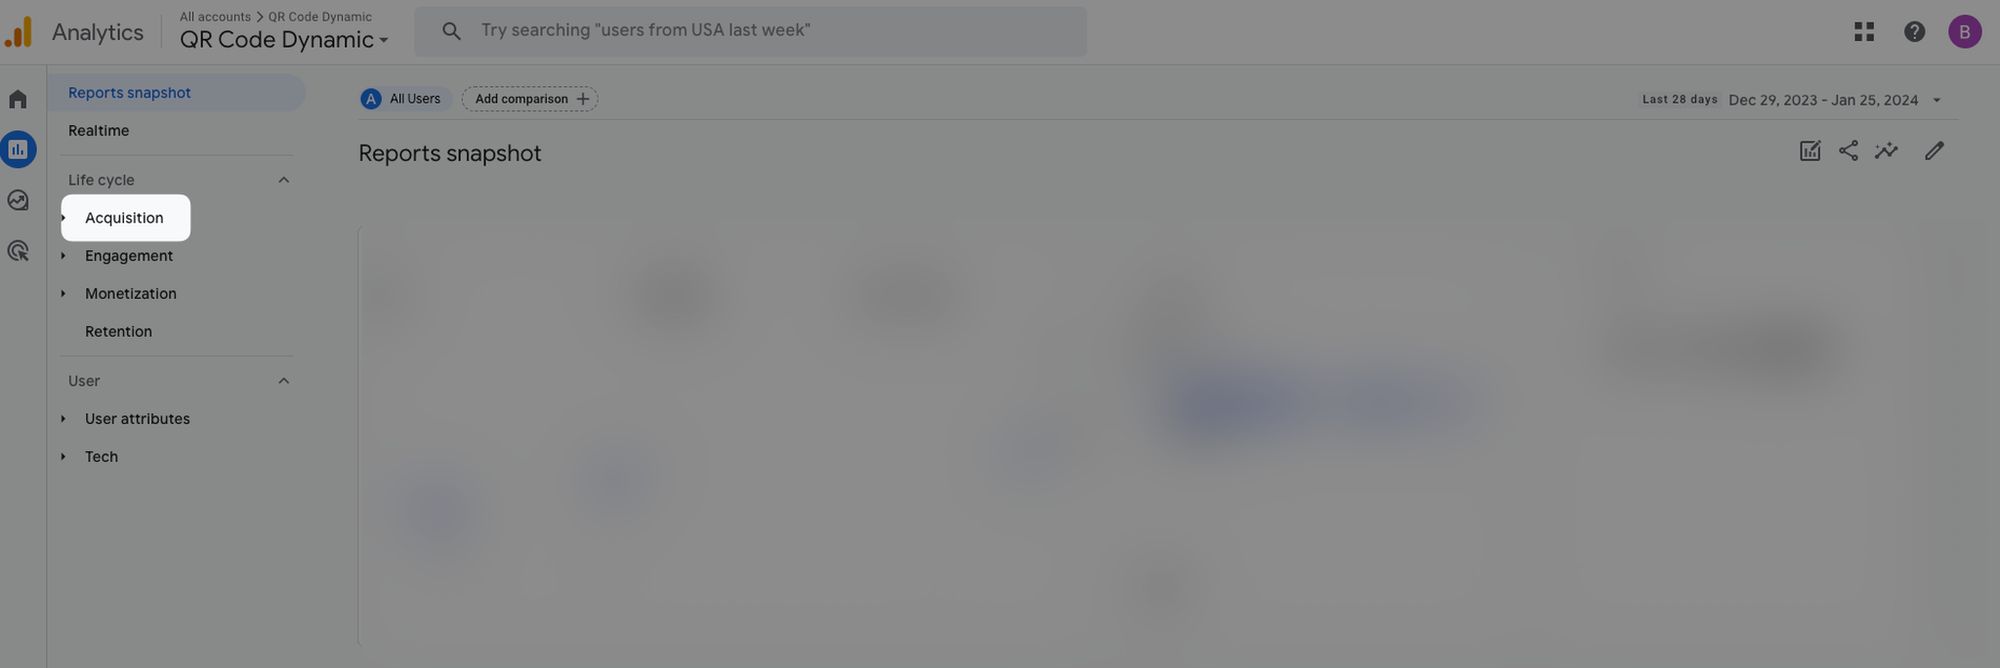
Finding Your Campaign Data
- Open Reports > Acquisition > Traffic acquisition.
- Change the primary dimension dropdown to Session source / medium.
- Find the row matching your tags, like
storefront-poster / qr_code. - To isolate one campaign, click the search/filter bar and filter by your
utm_campaignvalue.
The Metrics That Actually Matter
Don't drown in columns. For QR campaigns, these four tell the story:
- Sessions: how many visits your codes drove. Compare this against your platform's raw scan count to spot drop-off.
- Engaged sessions & engagement rate: whether scanners stuck around or bounced. Low engagement usually means a landing-page problem, not a QR problem.
- Key events: the conversions you defined in Step 4, this is your ROI line.
- Total revenue: for ecommerce, direct dollars tied to the campaign.
Building a Custom QR Channel (Optional)
If QR is a recurring channel for you, create a custom channel group so it stops hiding inside "Unassigned." Go to Admin > Data display > Channel groups, create a new group, and add a rule that captures any traffic where Session medium exactly matches qr_code. From then on, QR shows up as its own line next to Organic, Email, and Paid, which makes board-deck reporting far cleaner.
Adding Scan-Level Data With a Tracking Pixel
To merge GA4's behavior data with raw scan counts, you can attach a Google Analytics pixel directly to a dynamic code. In QR Code Dynamic, open the Links page, edit your link, scroll to the Pixels section, and click Create a Pixel.
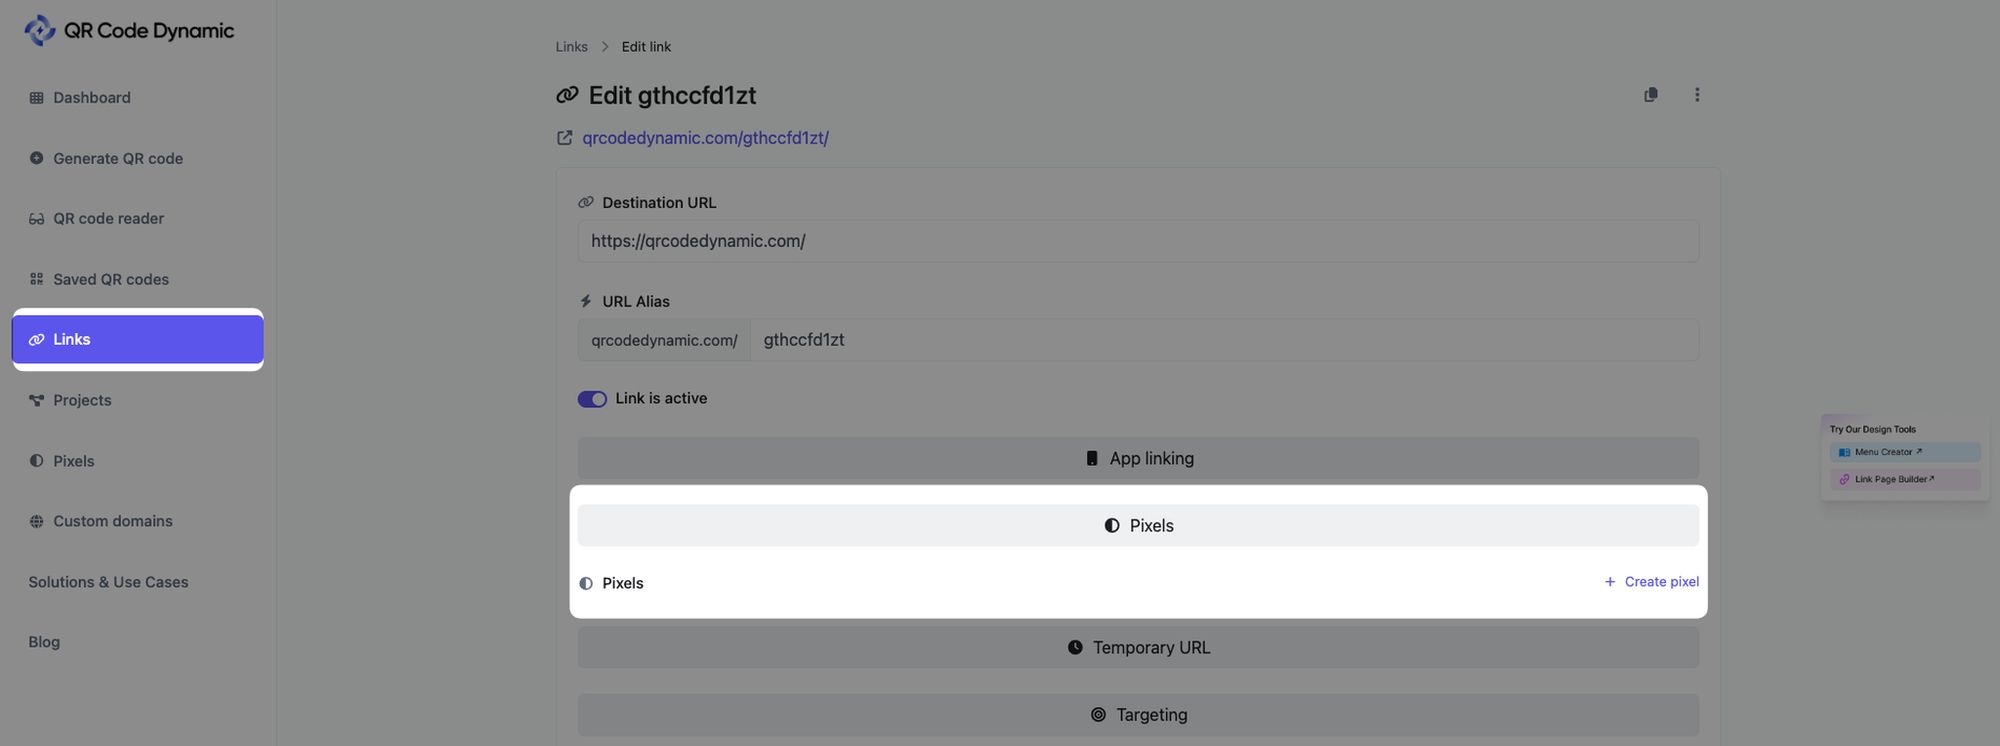
Select Google Analytics, enter your Measurement ID, and save. Now the redirect itself fires a GA event, so even scans that abandon before the page fully loads leave a trace, closing part of the scan-versus-session gap GA4 normally misses.
Best Practices for QR Code Analytics
Setup gets you data. These habits get you data you can trust, refined across dozens of print and packaging campaigns.
- Lock a naming convention before you print anything. Lowercase, underscores, and a fixed
qr_codemedium, documented so nobody inventsQRcodemid-campaign and fragments your reports. - Always send scanners to a fast, mobile-first landing page. Most QR traffic is on cellular data. A slow page turns scans into bounces that never register as sessions.
- Use dynamic codes for anything printed. Fixing a destination or a UTM typo without a reprint pays for itself the first time something goes wrong.
- Compare scans to sessions every week. A widening gap is your earliest warning that a landing page, redirect, or print-quality issue is leaking traffic.
- Set a key event for every campaign. Scans without a conversion goal are vanity metrics. Tie each code to a real action.
- Respect privacy and consent. If your audience includes EU visitors, configure your consent banner and GA4 consent mode so you collect data lawfully and keep it clean.
For physical asset programs where each code maps to an item or location, the same discipline applies, our guide to QR code asset tracking shows how to extend this naming structure across a whole inventory.
Common QR Code Tracking Mistakes to Avoid
Most "GA4 isn't tracking my QR codes" complaints trace back to a handful of fixable errors. I've made several of these myself, so here's what to check first.
- No UTM tags at all. The number one cause. Without them, QR scans pile into
(direct) / (none)alongside bookmarked and typed-in traffic, and you can't tell them apart. Always tag the destination URL. - Inconsistent parameter casing.
QR_Code,qr_code, andQRcodebecome three separate rows. Standardize to one lowercase value forever. - Redirects that strip parameters. If your code points to a URL that bounces through another page, the UTM string can vanish before GA4 reads it. Always test the final landing URL, not the first link in the chain.
- Confusing scan counts with sessions. Your QR platform counts scans; GA4 counts visits. They will never match exactly, because some scans never load the page. Expect a gap, and investigate only when it grows.
- Expecting GA4 to count the scan itself. It can't. GA4 starts measuring at the page visit. For true scan-level numbers you need a dynamic code's own analytics or a tracking pixel.
- Using static codes you can't edit. A typo in a static code's UTM value means reprinting everything. Dynamic codes let you fix the destination in seconds. A blurry or trimmed code is its own failure mode, so review our notes on QR code scanning problems if scans aren't landing.
- Ignoring attribution windows. Offline scans often convert days later. If your attribution settings are too short, GA4 quietly drops credit for the QR touchpoint.
Start Measuring Every Scan
Tracking QR codes in Google Analytics comes down to one principle: tag the destination URL with consistent UTM parameters, then read the results in Traffic acquisition. GA4 handles the behavior and conversion side, while a dynamic code adds the scan-level layer GA4 can't see on its own. Together they turn a printed square into a measurable, optimizable channel.
Your first move today: build one UTM-tagged URL in Google's Campaign URL Builder, encode it in a dynamic QR code, and run a single test scan against GA4's Realtime report. Once you see that one scan land with the right source and medium, scaling to a full campaign is just repetition. If you want to understand what's encoded inside the code you're printing, the structure of a QR code is a quick, useful read before your next print run.
Frequently Asked Questions
Can Google Analytics track QR codes?
Yes, indirectly. Google Analytics can't see the physical scan, because that happens inside the phone's camera app. What it tracks is the page visit that follows the scan. When your QR code points to a URL tagged with UTM parameters, GA4 records that visit with the source, medium, and campaign you assigned, so every scan-driven session is attributable.
How do I track QR code activity?
Tag your QR code's destination URL with UTM parameters, then watch the results in GA4 under Reports > Acquisition > Traffic acquisition. For activity GA4 can't see, like raw scan counts, location, and device, use a dynamic QR code platform that logs each redirect. Combining both gives you scans and on-site behavior in one view.
How do I track QR code scans in Google Analytics 4?
Build a UTM-tagged URL with Google's Campaign URL Builder, encode it in your QR code, and confirm GA4 fires on the landing page using the Realtime report. After that, open Traffic acquisition, switch the dimension to Session source / medium, and filter by your campaign name. Set a key event to also measure conversions from those scans.
How can I see how many times a QR code has been scanned?
GA4 alone can't give you a true scan count, only sessions from people who reached your page. For an exact scan number you need a dynamic QR code, which logs every redirect including scans that never load the destination. The dynamic platform shows total scans, unique scans, plus location and device; GA4 then shows what those scanners did next.
What UTM parameters work best for QR codes?
Use three at minimum: utm_source for the physical placement (like store_poster), utm_medium set to a consistent qr_code so all QR traffic groups together, and utm_campaign for the specific initiative. Add utm_content when you want to compare placements or print batches of the same campaign. Keep everything lowercase with underscores to avoid splitting your data.